This page introduces the (provisional, not very good) name “ScreenWindows” for something we’ve been considering at didi for decades: interposing a conceptual window between an expert user and data. It’s our higher-level conceptualization of the Magic Lens [Bier 93] known in the InfoVis/UI community: a transparent overlay on data that filters or interprets what’s underneath, while letting most of it show through.
We think of it a closer to Augmented Reality overlays, though overlaying information on data representations instead of reality. And our conceptual overlays are not just grease-pencil annotations on a freeze-frame soccer game–additions to the original signal–but can push back into the representations themselves, for instance setting parameters or data feeds to a chart, or even telling the data feed to enhance itself for better display in the chart.
Here’s an ancient example, followed by some current thoughts inspired a decade ago by code/chart contextualizing tools like Jupyter Notebook, and more recently the OpenClaw sensation. We see OpenClaw as a textual ScreenWindow and hope to create a more ecologically-valid way of interacting—one that taps into our half-billion-year-old visual/spatial abilities, not just our text—not even 2% as old. And we’d say nowhere near as powerful for many information-understanding/organization tasks.
§
In February of 2018, almost two decades ago, we explored the idea of actively answering market-related questions for traders who subscribed to data feeds by creating Pool workflows tailored to specific, perhaps newly-breaking needs. Here’s an excerpt from an email to respected friend Jon Kellner, then CEO of Instinet:
Jonathan,
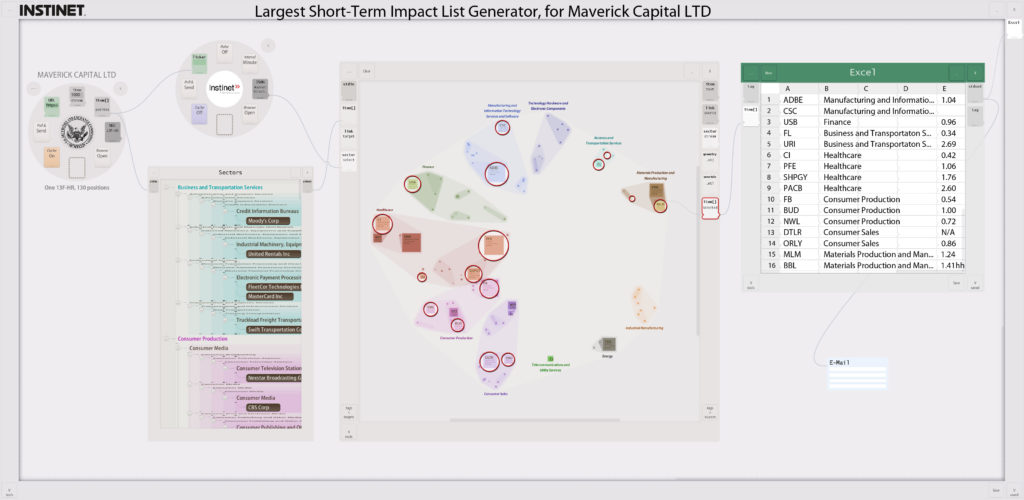
This recent market storm gave me an idea: suppose Instinet could respond immediately to market events–sending out working circuits that could be executed and produce concrete results the recipient can take immediate action on. Like evaluating and trading a list of dangerous positions.
In this mock-up, the circuit would bring in the most recent portfolio Maverick published, run some analytics (here, I just made up a “Largest Short-Term Impact” analytic), use that output to circle the interesting positions–in Maverick’s own portfolio–then email an Excel spreadsheet list of those positions to an address they could type into the final email module.
Rather than being one of the hundreds of emails traders or trading PMs receive saying “please use my data,” maybe they’d open yours immediately if they knew they’d see a live offering like this, and could drag it to their desktop, run it immediately. They could then pass it along to colleagues, or tweak it (e.g. substitute their current portfolio positions, or change parameters in the Instinet analytics module). Of course, micropayments for running these teaser circuits could be built in–but the end game would be to have hundreds of these running at the client: semi-robotizing their portfolio management procedures. (Or at least helping watch their back.)
You know your data best, and how to apply it most effectively, so this is an across-market comparative-advantage and economies-of-scale optimization. You’d provide data plus analysis–where the analysis is done just once by those best at it. Right now, it’s done at every firm (if it’s a valuable common practice); a huge global redundancy. In a world like this firms that don’t do a particular analytic procedure, or do it themselves each time, will be behind your customers: a serious incentive to sign up.
§
The ideas were already part of the Pool vision then, and within that time period they acquired more ambitious goals and more interesting physicalized interface implementation ideas. Here are some brief notes about those extensions, meant as a public disclosure (invent with us!), as well as to make the concepts clear enough to one “skilled in the art” that this may be considered prior art to prevent our ideas from being “panted out from under us.” We’d hate for such potentially strong ideas to be locked up as, e.g., patents, by any one firm: together we can invent the future; separately we may not make it there…
A searchable library of such Pool workflows—or even Jupyter notebooks—would be useful to knowledge workers in any field. AI abilities to map these themed workflows/charts to specific needs (e.g., a change in market conditions) could speed up acquisition of what’s often one step in a complicated decision-making process.
The ability to spatially organize such themed representations may make effortless “zero cognitive load” access easier. As cognitive engineers we often consider how certain cognitive needs were solved before computers. Often we can get inspiration from how well domain experts were able to “develop their own interfaces” with more mature technology, like paper. (See the Goldman NYSE handheld on our Product Design page: a good amount of its success—especially its instant, all-hands uptake—was due to the fact that we respected and unabashedly copied the existing pads used by brokers—designed by brokers—with innumerable suggestions over the last two hundreds of years.)
Consider how targeted information was stored hundreds of years ago, and often still today. Many people still have bookshelves of paper books, and a physical desktop on which to rest them when they need to consult several at one time. It’s obvious to us that spatial organization allowed many people to reach to an exact place in a bookshelf—even turn to an exact page—without interrupting their current thought processes. Compare that to accessing a new resource today, where the act of searching for the resource might interrupt the very decision process it was meant to serve—especially if one has to navigate to a search tool, wait seconds for a list of possibilities to appear, navigate to the right one (possibly among several distracting near-misses), wait again while it loads, and find the right spot in the document. Just thinking about all these steps almost made me lose track of my own point: that grabbing a book can be effortless—and because it employs pre-attentive muscle memory—does not overload working memory with distracting UI coping-with-the-interface micro-tasks.
One admittedly far-out implementation would layer something that looked like actual bookshelves over one’s environment in an augmented reality headset or glasses. They might all be semi-transparent and just at easy arm’s reach, and since you yourself curated the organization and placed resources where you expect them, your spatial memory would let you grab these “virtual books” without interrupting why you were reaching for them in the first place. And a special “I’m working on this” shelf—even one for each ongoing task—would be a fine way for ad-hoc task-specific organizations of resources. Of course charts pulled onto such task-themed shelves would retain state: what data is being displayed in what way. The shelf might even provide context for new charts dropped on it, e.g., if I’m looking at a list of stocks within a sector dragging a time-series chart might automatically start me with a time series of those stocks. And if I’m looking at a market event, e.g., news relating to that sector, annotations might appear on the time series chart to point out where that news impacted the price, explain why people think it did, and provide links to other resources.
A less far-out version would be an obvious evolution of today’s management-targeted “build your own dashboard” apps, where people can start with a blank dashboard and drag the resources they want (specific kinds of data, and charts to represent it). Certainly if a manager tailored charts and data to answer a specific need themselves, all those tailoring choices are retains for the next time they have that need. More generally, they could also ask internal or external experts to create chart/data for past of future needs they may have, and populate a library of these pre-task-targeted resources. Descriptive context—like a “what question does this answer” text block and task-revealing title—could be used to allow filtering and search. Might even be enough metadata context, once the library’s large enough, that an AI agent could create new resources on the fly, by using patterns associating metadata use intents (the question) to generated chart (the resource/answer). For instance, if I have looked at two dozen short lists of stocks in two dozen sectors over the last year, every time there was a significant news even in that sector, even today’s simple LLMs have a shot at creating a more generalized task-resource-shelf that would populate itself automatically with reports of news in a sector I never visited—but just released market-impacting news—and show me a short list of the most impacted, and charts of prices with the associated explanatory overlays & links. Even better if these patterns are found among many experts, even better if the task-resource-shelf could be vetted by other expert users (“this isn’t just slop, and I tuned the language and added a couple more resources to be more useful”).
This is just one way that points toward a primary future didi has been building for many years: tools that evolve in the hands of the experts themselves. We were proud to have brought the expert-honed structure of the paper pads NYSE brokers used into their handheld-computer interface. We’d be even prouder if we could enable experts to do this themselves—human-out-of-the-loop (well, designer/coder-out-of-the-loop) might well be a major step toward a future of better, more rapidly-evolving tools—and hybrid man/machine thinking processes in general.